
Excess Bullishness
- Evan Zachari
- Jul 24
- 4 min read
Updated: Aug 2

Topics Of Discussion:
Technical Backdrop
Earnings and Seasonality
Retail Complacency, High Beta, & Speculation
Bottom Line
Technical Backdrop
Reaching new all time highs and continuing to follow the long-term upward trajectory post GFC, the path to continuous long-term gains is laid out to be followed. At times when markets seem not as easy to read, it’s best to take a step back and look at the bigger picture. As you can see below, slope of the trend is up, we are making new highs above the trend line, and breadth is decent.
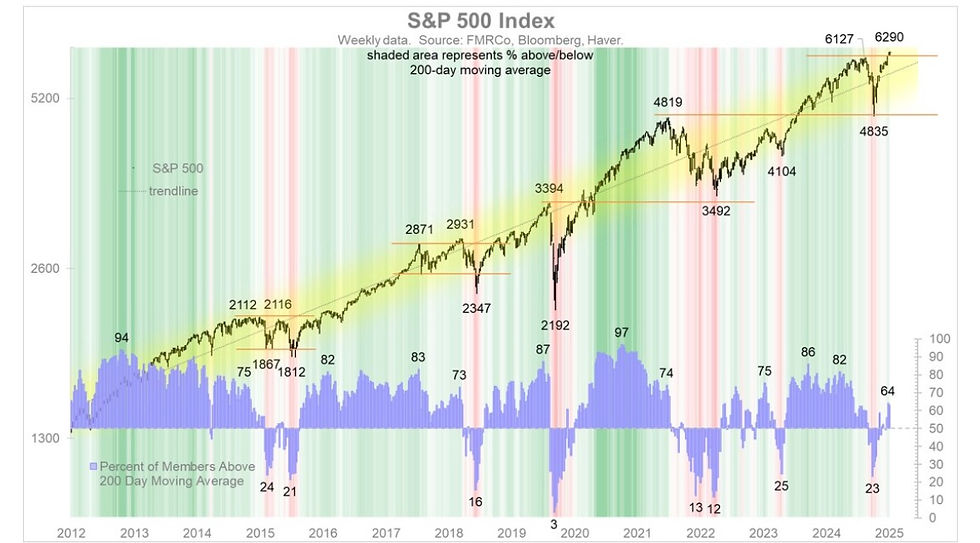
At some point the index will be too far above its rising trend line, and in response revert to mean. It is our job to determine when that is most probable and take risk off the table.
Currently, bullish sentiment has been reinforced by a belief that inflation is finally cooling without significantly denting corporate profitability. There are growing expectations of Fed rate cuts later this year, and an abundance of investor liquidity chasing momentum. Mega-cap tech and AI-related names remain key drivers with earnings surprises and guidance upgrades boosting confidence, and record speculative activity suggesting a market driven by sentiment rather than fundamentals. Nonetheless, it is ours to capitalize off of.
As we compare the recovery from April lows to prior price action following 20% drawdowns, it is clear the market has been performing at a historic rate. Best compared to the 1999 and 2019 performances, if we continue to follow in a similar direction we can expect to see momentum continue into year end unless given a reason otherwise.

S&P 500 Index remains nearly 10% above its 100-day moving average and close to 9% above its 200-day moving average. Although not the best timing indicators and more of caution signs, technical indicators like RSI and MACD are starting to reach overbought conditions.

Back to levels of ‘Extreme Greed’, a score of 76 reflects strong investor optimism, but is a precautionary sign from a contrarian standpoint. Levels of extreme greed tend to coincide with short term tops.

Following the bullish advance from April lows, S&P 500 index has traded above the 20-day moving average 63 days in a row. To give an idea, this has only happened 8 other times since 1950. Outcomes are as follows.

Fuelling this rally, tech continues to lead the pack, holding a strong uptrend while now comfortably above short and long-term moving averages. The US Info Tech sector now accounts for ~34% of the S&P 500, as measured by market cap, matching the record weight that the sector enjoyed back in ‘99/’00.
Earnings And Seasonality
So far, 87% of companies reporting through Thursday(July 24) have beat expectations, primarily in Industrials, Financials, Healthcare, and Technology. This is no surprise considering the heavy cuts in expectations approaching earnings season, mentioned in our previously posted Earnings & Buybacks Q2.

Aligning with seasonality trends, volatility compression reflected in the VIX declining below 15 suggest we should expect a spike in volatility sometime in the near future (would also align with VIX trends). This would give the market a necessary breather.

As we wrap up the month of July, we enter two of the weakest months in the year. Combining this with VIX seasonality picking up in August suggest probabilities of a pullback are elevated.

Election years also tend to top during August, before entering January with a light year-end rally.

Retail Complacency And High Beta
Retail speculation is once again gripping the markets. It’s a glaring warning sign of rising risk-taking behaviour among retail investors. History consistently shows that markets peak when the average investor starts chasing lottery-like returns. This cycle of retail speculation is nothing new. In early 2021, just months before the market corrected in 2022, we noted how inexperienced retail investors were rushing into markets, exhibiting high confidence without the experience to manage risk appropriately.

Not only are retail investors becoming increasingly active, but they are the increasingly making use the latest 'gambling' vehicle, zero-days-to-expiration (0DTE) options. According to CBOE, trading volumes in these contracts have surged nearly sixfold over the past five years, with retail traders now accounting for more than half of all transactions. Options, by design, are speculative instruments used to hedge risk or make directional bets. However, the explosion in 0DTE options points to a significant behavioural shift from investing to outright gambling.

Adding to the risk-on environment, is the “high beta” chase by retail investors as noted by JP Morgan.
“The latest bout of extreme crowding, currently in the 100th percentile, is in high-beta stocks. This spans both riskier low-value and speculative growth plays. It is also the fastest pace in 30-years.”

Speculation in risky stocks is one thing, but speculation combined with leverage turns ordinary pullbacks into major corrections. Today we see a spike in amount of money borrowed to buy stocks, specifically within equity markets.

Bottom Line
Retail behaviour creates is a dangerous setup. They borrowing more to buy more stock, piling into leveraged ETFs while speculative call options massively outweigh protective puts, and crowding into high-beta stocks. These dynamics create a fragile market structure. Rising prices fuel more leveraged buying, which pushes markets higher in a feedback loop. But when selling starts, the loop reverses—margin calls kick in, forced selling accelerates, and liquidity evaporates, causing sharp market downturns.
Today the driver may be different, but the warning signs are no different: extreme retail optimism, widespread leverage, and total complacency towards risk.
This is not implying the market will crash tomorrow, in a week, or in 6 months, nor is it implying we are not long and exposed to markets, it is simply to note there is activity to be cautious of.
With the market feeling euphoric and on a historic run, a 5-10% correction is definitely in the cards. What will drive this is to be determined, but entering a period of poor seasonality and a compressed VIX suggest that probabilities of a pullback are elevated.